1+1[1] 2There is some minimal knowledge of R that will be necessary to get started.
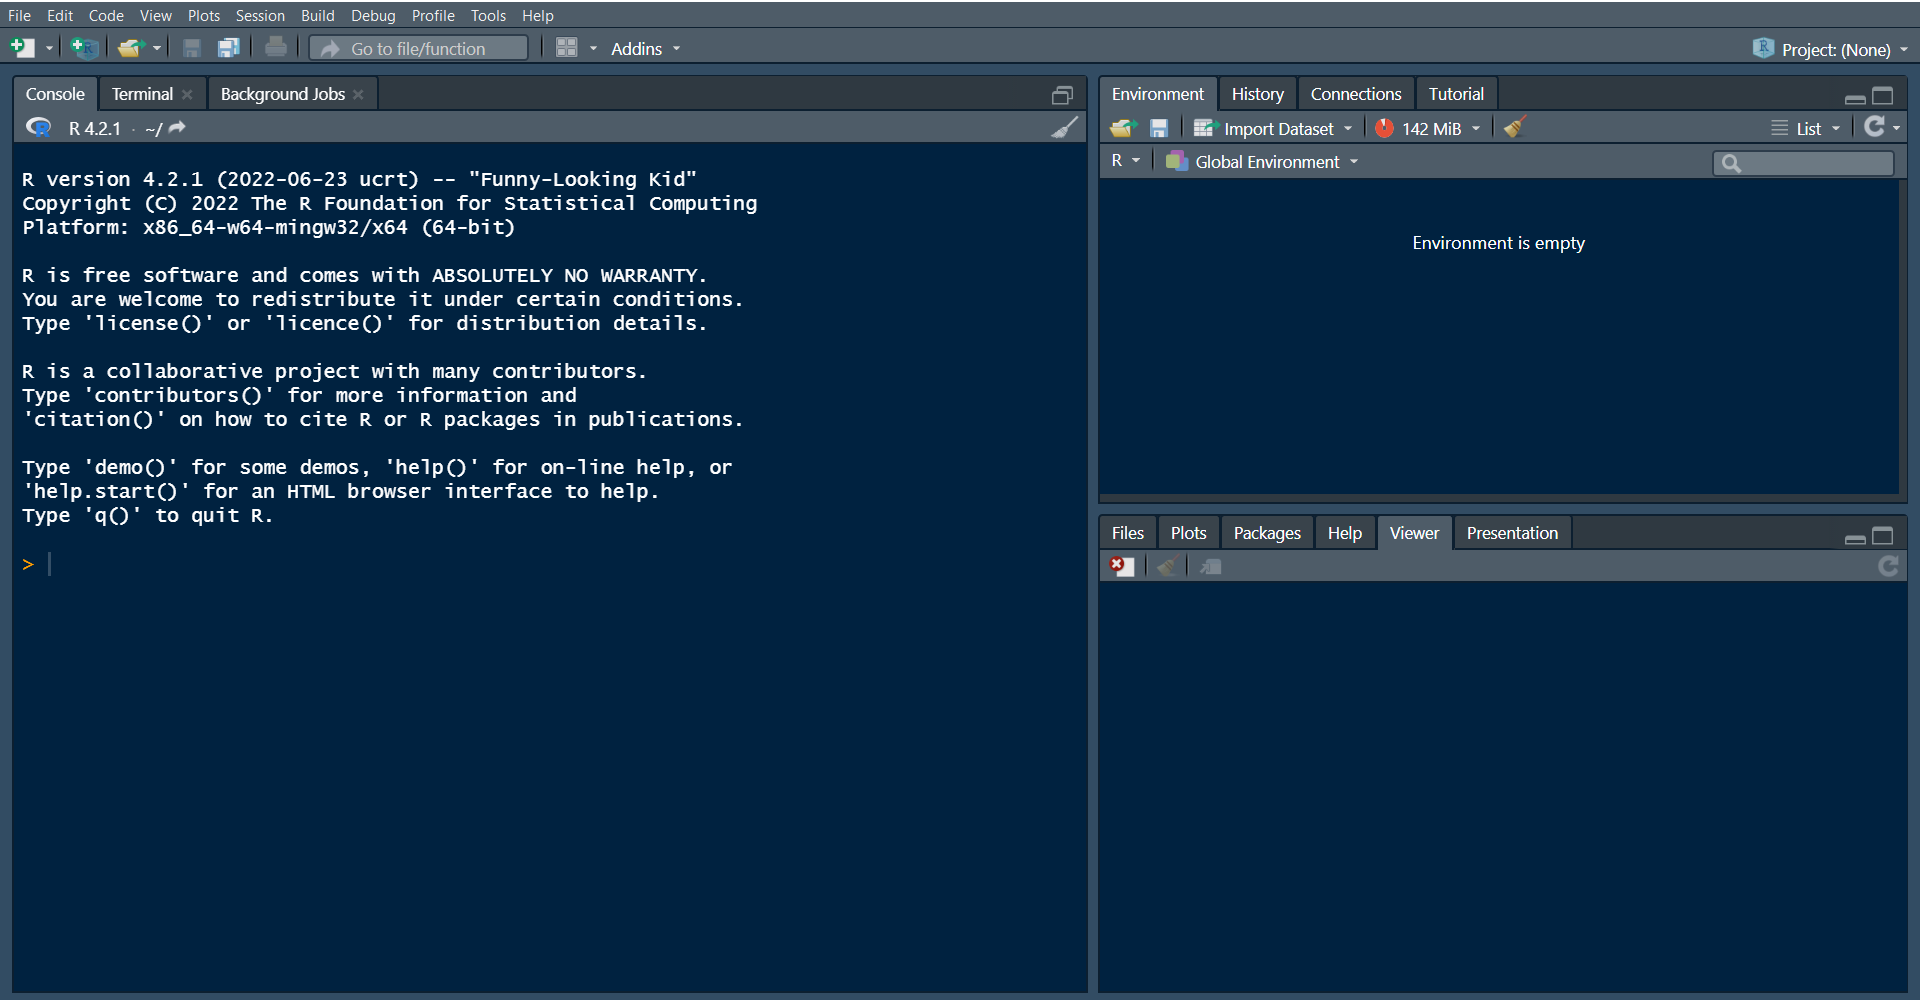
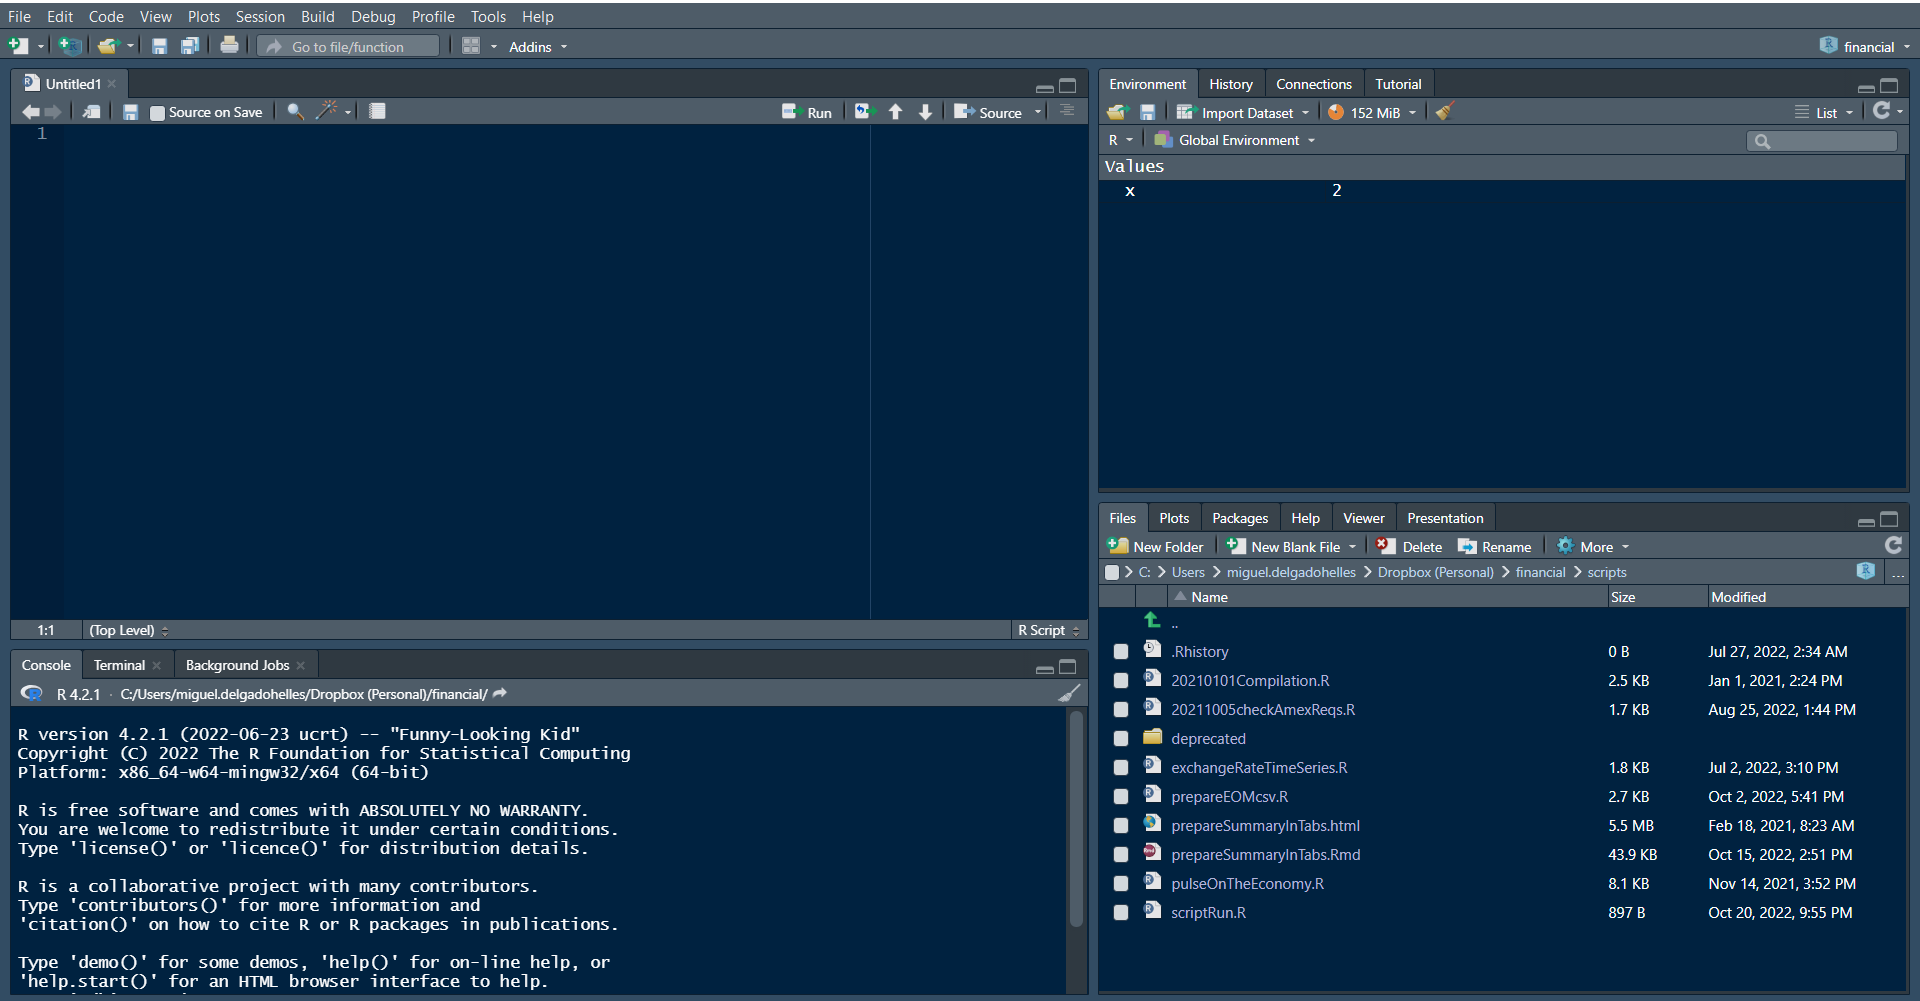
Once you have installed R and RStudio, when you first open RSudio, it should look somewhat similar to the image above, a screen with three different panes. Note the color scheme on your computer may be different than mine.
R is an interpreted language, so we write expressions and an interpreter in R executes the code that we write. You can work interactively in the console. The console is the large pane on the left side of the screen.
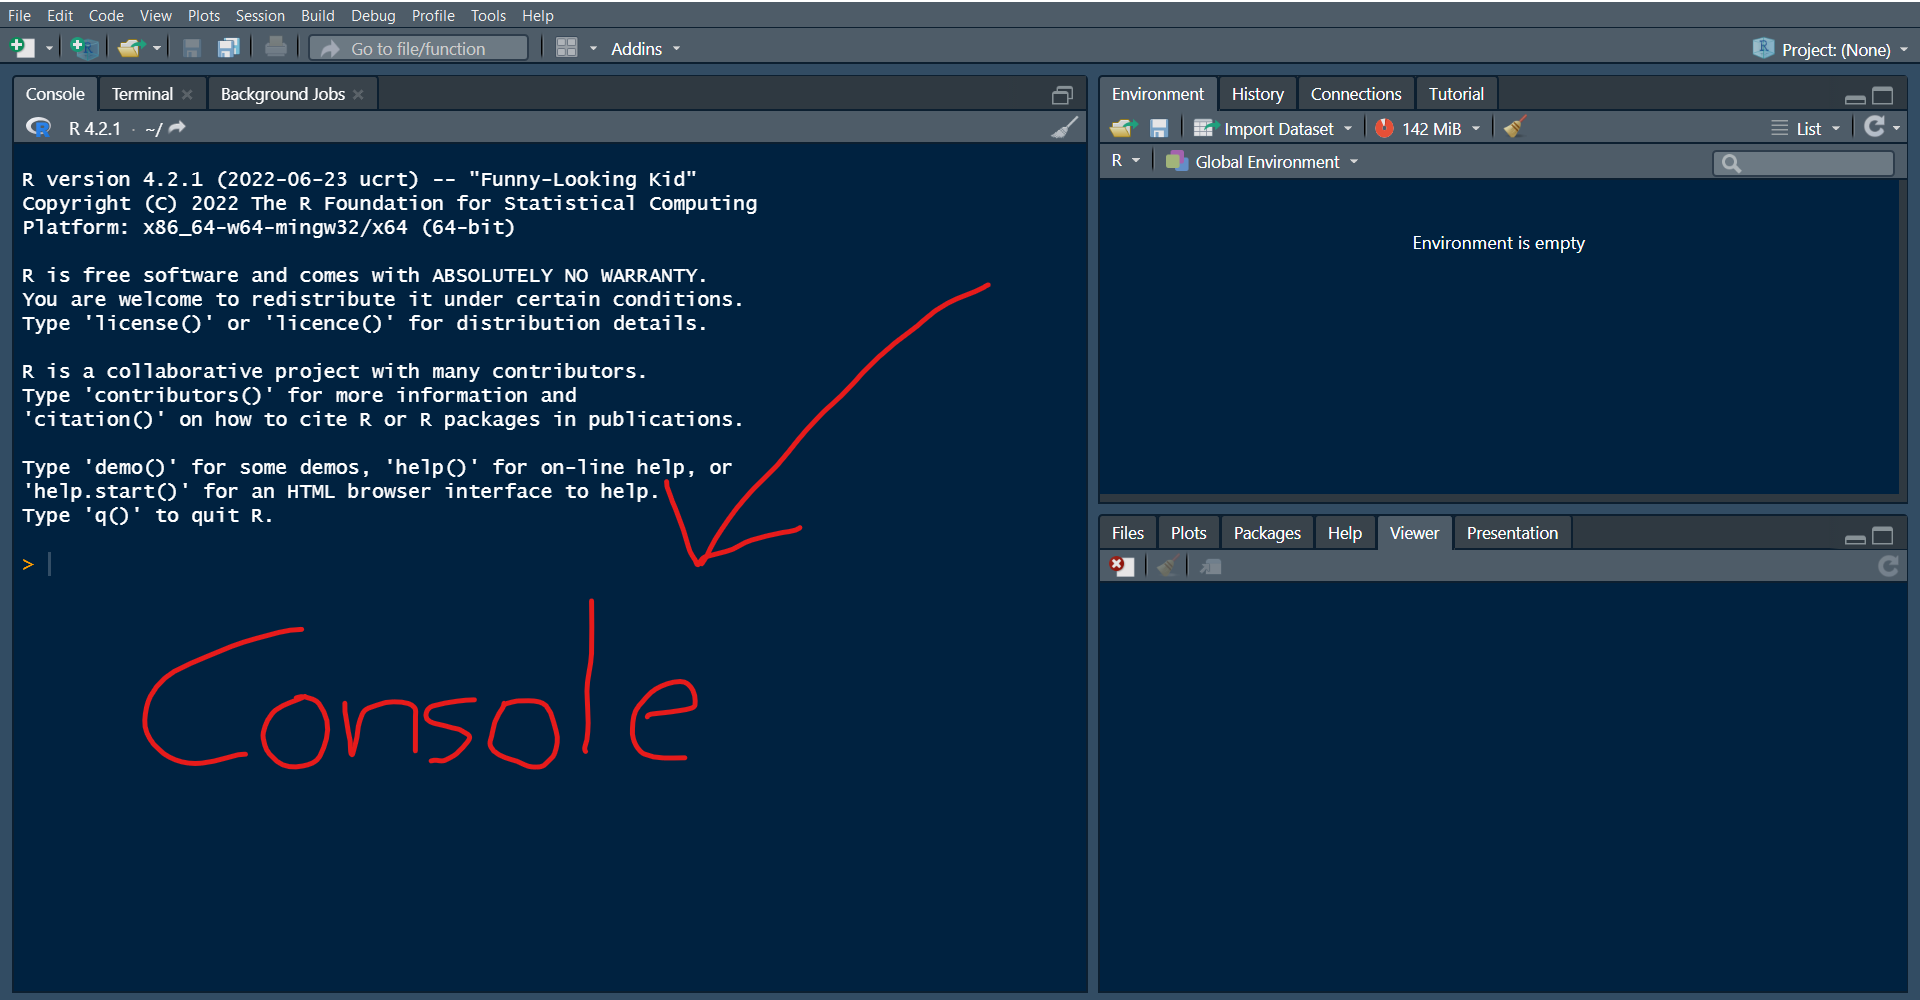
In the console, at the prompt (>), go ahead and type “1+1”, then hit enter.
1+1[1] 2Right under what you typed, you will see the result of your command, as well as an item number in square brackets (ignore that for now).
R is also an object-oriented programming language, so much of what we do in R is assign values to objects we create. Pretty much anything we “create” in R will be an object. For example, if we wanted to store the result of the calculation we did above, we could assign it to an object. In this case I will create an object called “x”, and I will assign to it the value of the operation 1+1.
x <- 1+1If you do this, and you look at the right pane, you should now have an object called “x” in your environment.
You may have noticed when I created the object I used “<-” to assign the value of 1+1 to the object called “x”. This symbol is R’s assignment operator. If you are using a PC, you can press “alt” and the dash (-) symbol at the same time, and that will insert the assignment operator. If you are using a Mac, press Option and the dash (-) at the same time.
You can also use the equal sign as an assignment operator, but I would recommend getting in the habit of using the assignment operator.
The work flow in R will often entail the following steps:
Loading some data into R
Cleaning the data
Manipulating the data to produce desired statistics and visualizations
Producing output (figures, tables, reports)
Often times, your original data may be a csv file (or set of files), and one of the nice things about working in R is that you can feed the data into R (step 1 above), and you can do all your analysis (steps 2 to 4 above) without ever modifying the original data. I find it useful to create a structure of folders for each project, in which I normally have at least the following three sub-folders:
data
scripts
output
I place the original data set(s) in the data folder, I save any scripts I work on (see Section 5 below) in the scripts folder, and as I do my work, I save any output I produce (like graphs) in the output folder.
For the R workshop, I would recommend creating a folder on your desktop, and name it something that makes sense. I will name mine, for example, “Plot-a-thon R workshop”. Within that folder, create the three sub-folders I suggested (data, scripts, output).
If you started a Word document, and you were to hit the “Save” button, it will open a dialog box for you to save the file, and it may suggest you save it in some directory like “My Documents”. In this example, “My Documents” would be the default working directory. In a similar way, when you open RStudio, the program will be running with some default location as the working directory. If you were to produce and save a graph, RStudio would save that graph in whatever that working directory is. I recommend as you start your R work session, that you specify the working directory where you want to be working, and that will make it easier to both load data into R, and also find the output you produce.
If you created the “Plot-a-thon R workshop” folder I suggested, you can set that folder as your working directory. In my case, I created this folder in a USB drive (Drive D), so the path to my directory is
D:/Plot-a-thon R workshop
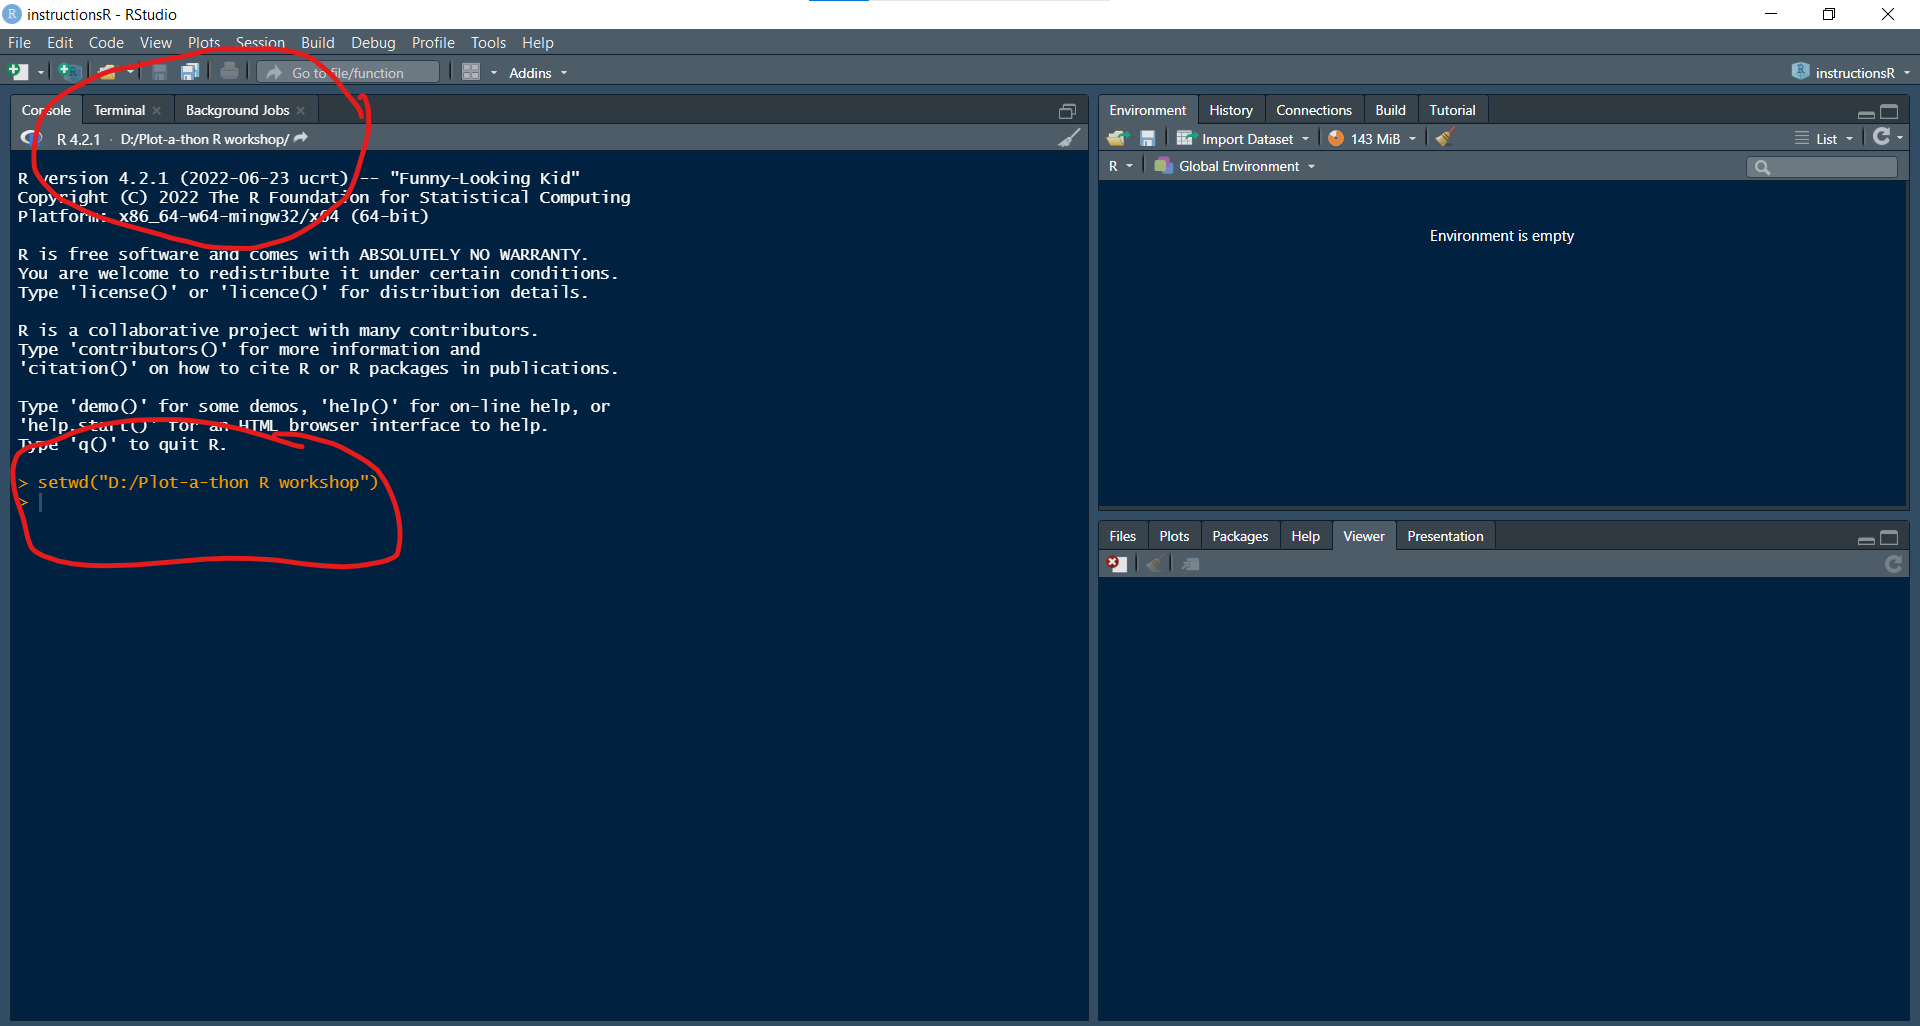
Accordingly, I can set my working directory by typing the following command in the console and hitting enter:
setwd("D:/Plot-a-thon R workshop")Once you have run this command, you should be able to see in your console what your current working directory is.
Instructions on how to find the path for the folder you created are provided below. Choose the tab corresponding to your operating system to see the instructions.
You can double click on the folder you created, and then click on the navigation bar, which should allow you to see the entire path to your directory. You should be able to copy that path and paste it onto the console as you write your “setwd()” command.
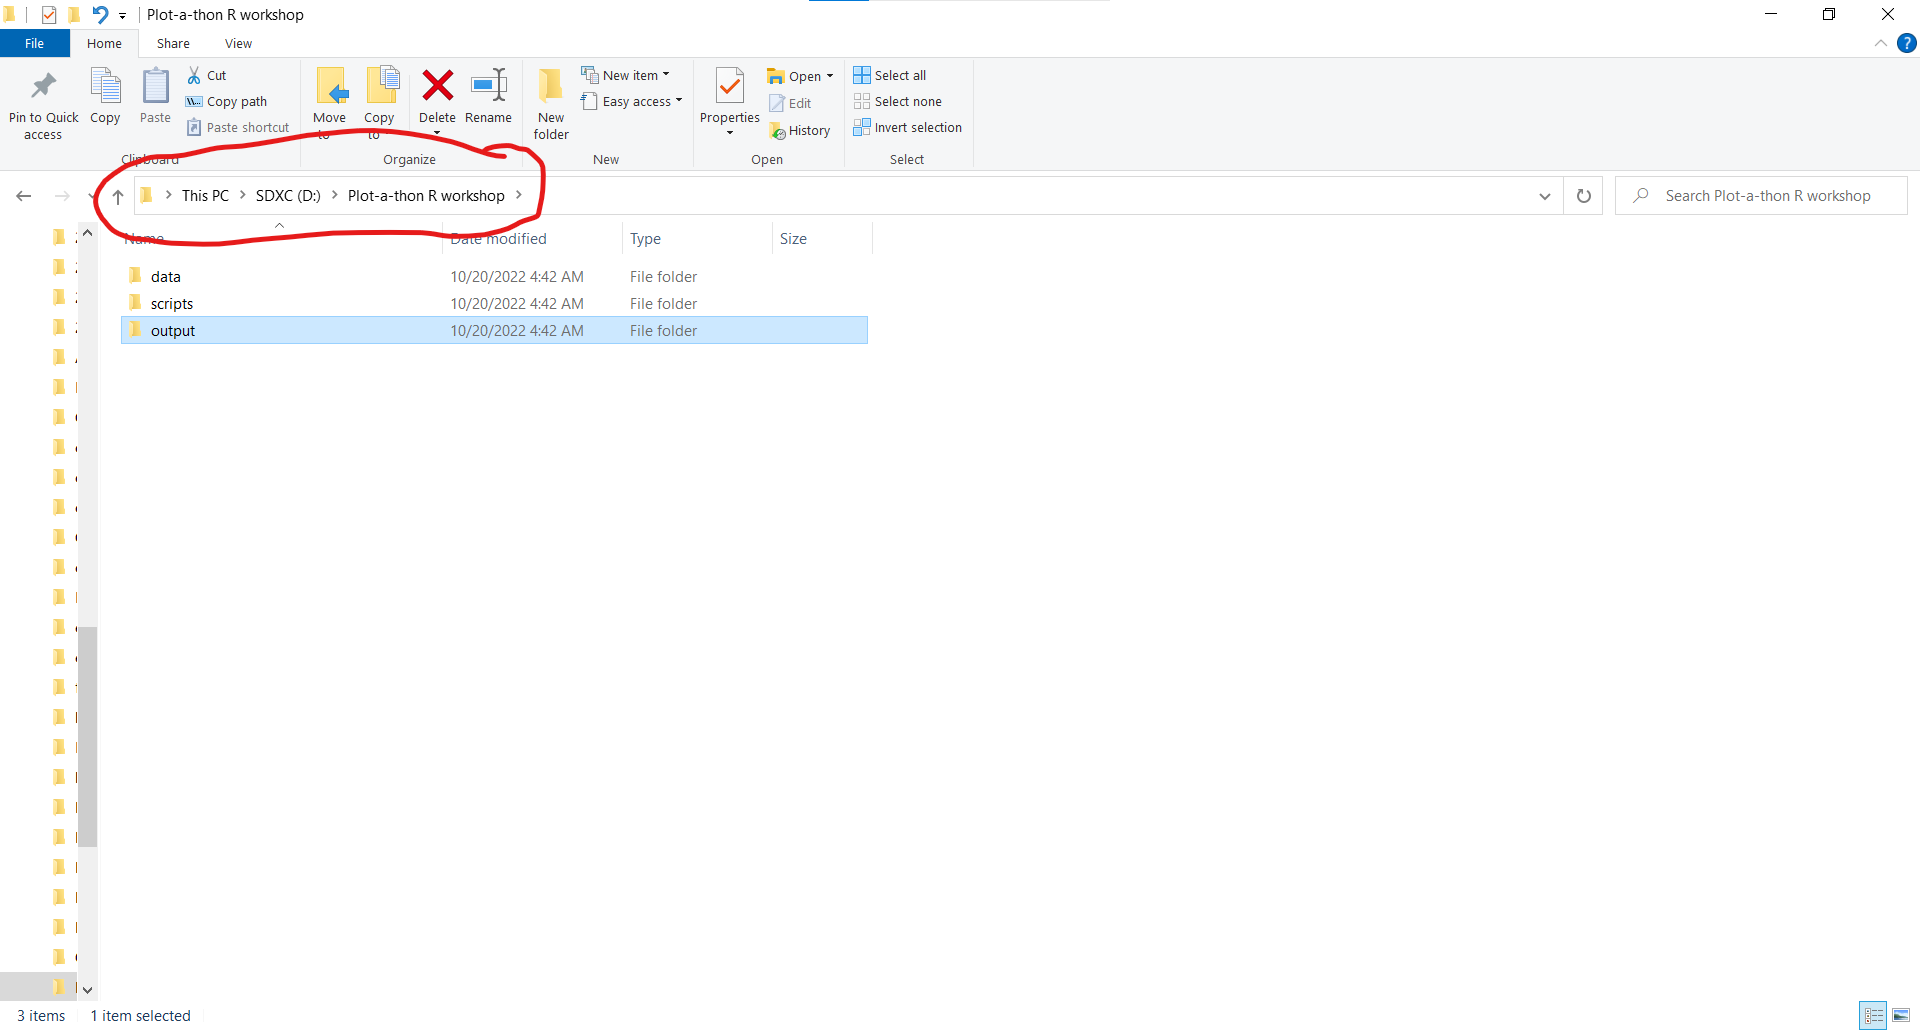
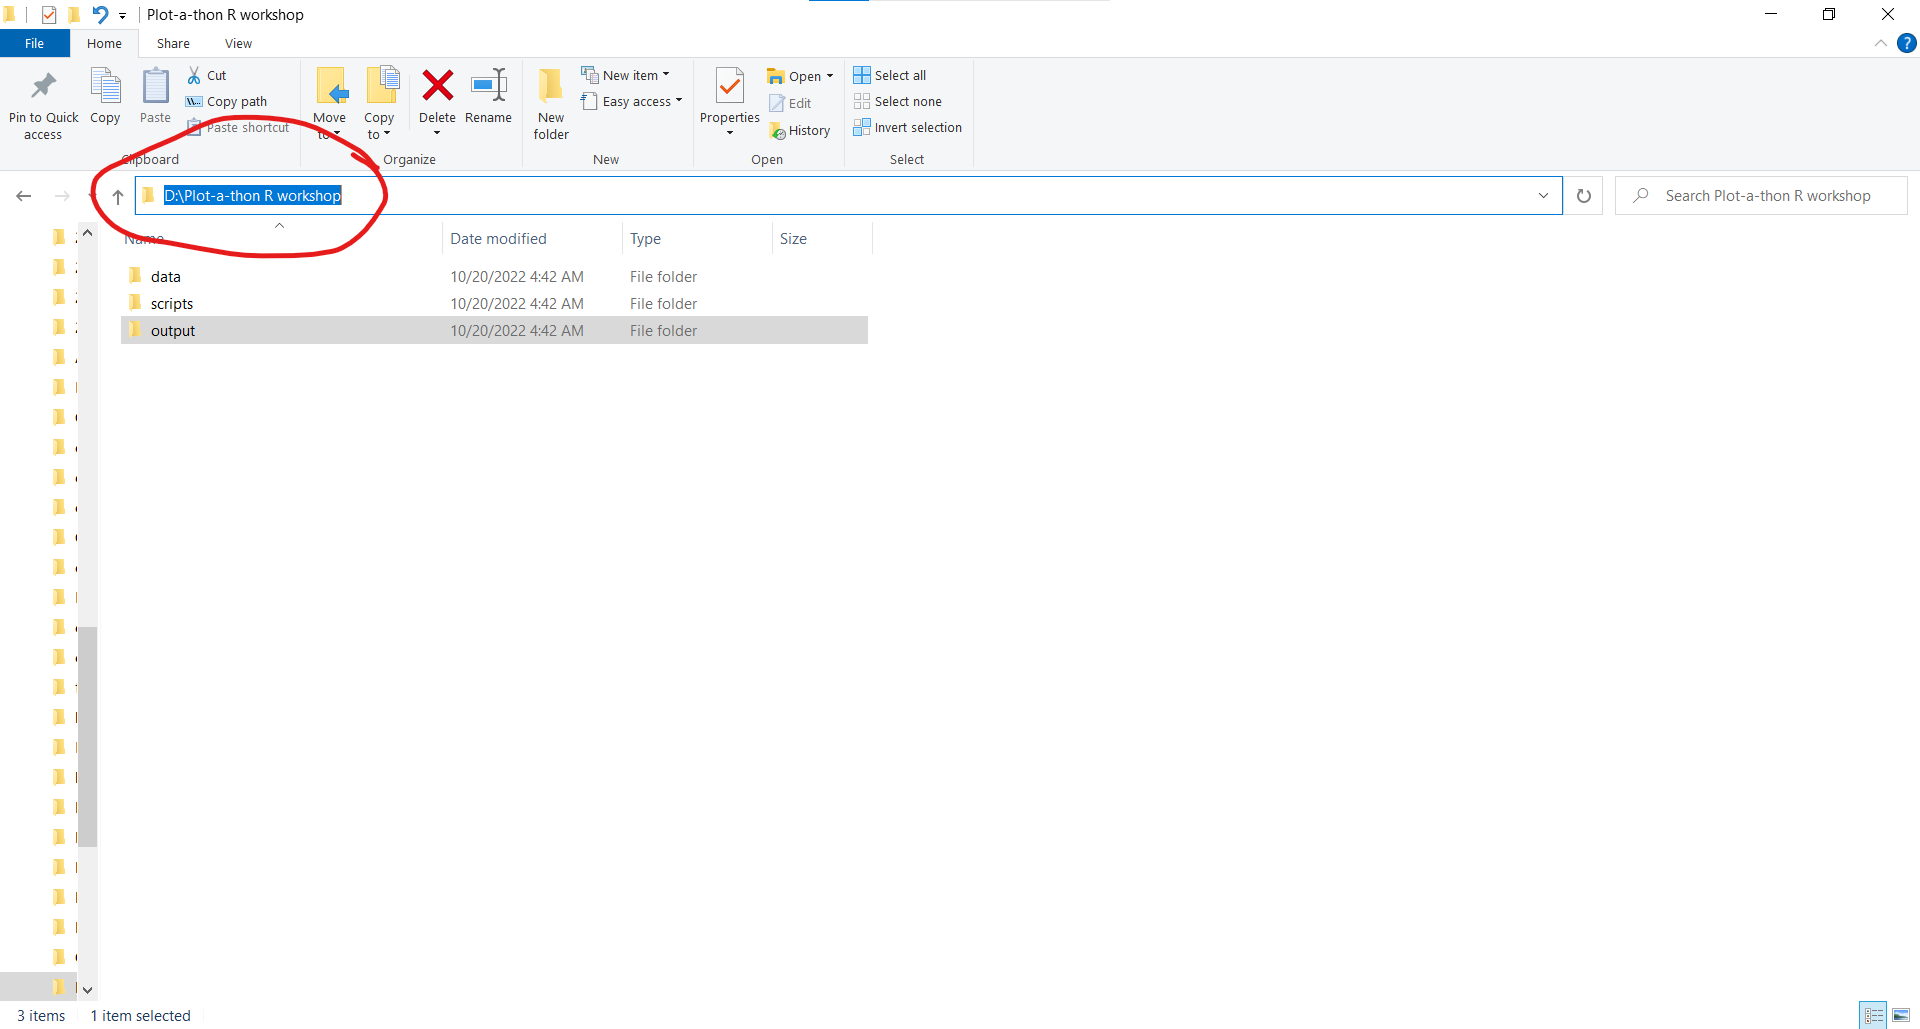
A couple of important things to note:
The path should be wrapped by quotation marks
PCs default to back slashes. You should change these to forward slashes as you put it in your path
Go to the folder you created. Click the Finder icon in the Dock to open a Finder window. Choose View > Show Path Bar, or press the Option key to show the path bar momentarily. The location and nested folders that contain your file or folder are displayed near the bottom of the Finder window. You should be able to copy that path and paste it onto the console as you write your “setwd()” command.
R comes with a number of built-in functions and capabilities. Nonetheless, there is an active development community that creates and maintains a number of specialized packages or libraries. Usually, when writing R scripts (the programs we use in R), we load the packages that we will need for the particular script. I almost invariably always utilize the tidyverse package. Also, if you are interested in creating interactive graphs, you may want to use the plotly package.
In the instructions below, notice that you can hover over the box, click on the clipboard, and then you can paste it on the console, and then hit enter to run the command.
To install the tidyverse package, in the console, type (or copy and paste)
install.packages("tidyverse")Note that tidyverse is inside quotations.
Similarly, to install the plotly package, in the console, type
install.packages("plotly")Note again that plotly is inside quotations. One thing that may happen when installing packages is that you will be notified that dependencies are installed. These are basically other packages that may be required in order to run the package you are installing.
A couple of good reasons for using a program like R to do data analytics and visualization are tractability and reproducibility. That is, being able to trace back your steps (for example, what you did to clean your data) and being able to reproduce these steps (either with the same data or a different data set). Because of this, rather than working interactively in the console, we will generally write R scripts, which are programs where we provide R with a series of instructions in a particular order, much like a recipe.
In order to start a new script, click on the “New file” button at the top-left corner of the RStudio window, and choose the first option, “R Script”.
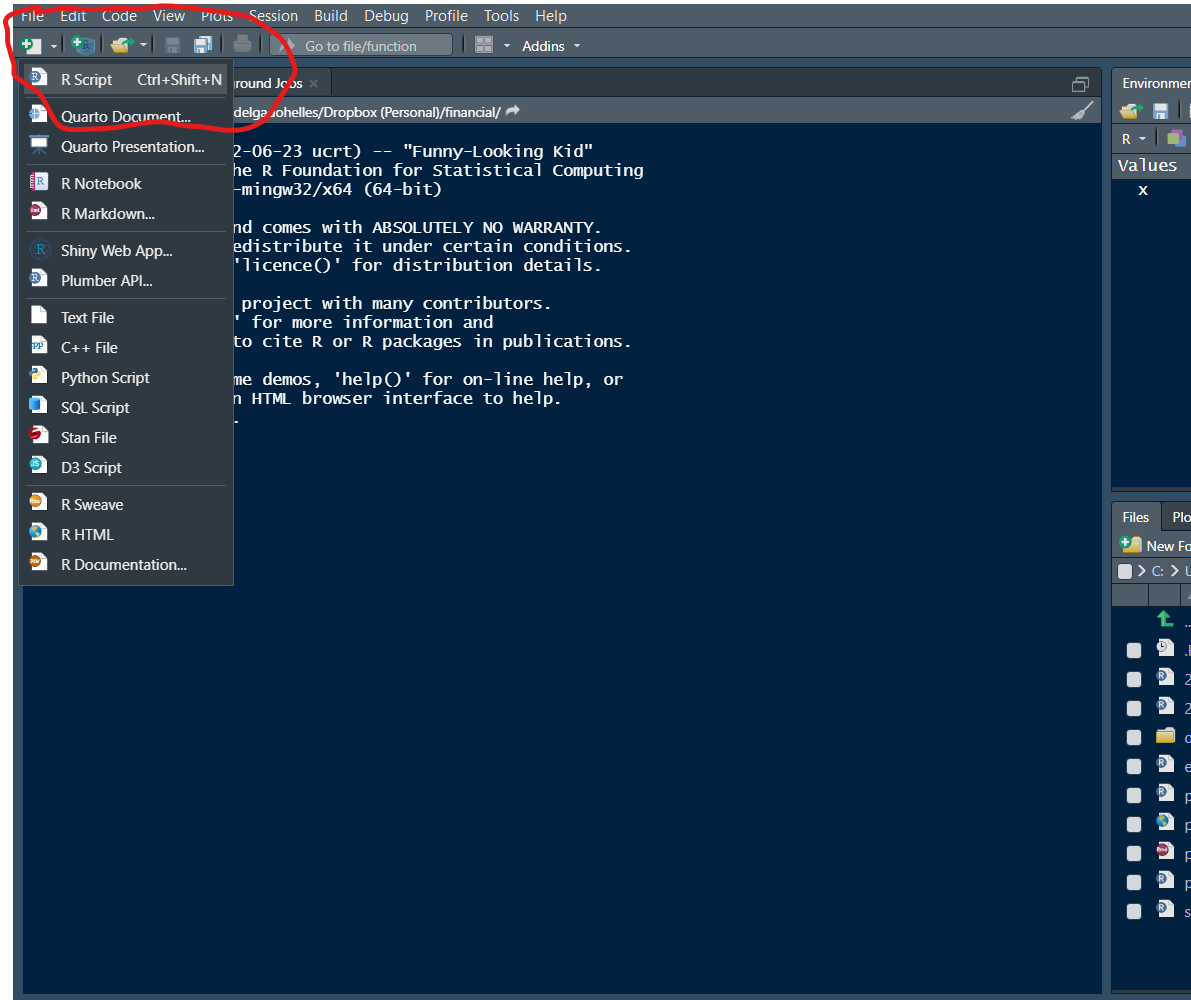
Once you choose a new R script, you should end up with a four-pane RStudio window, the top left will be your script, the bottom left the console.